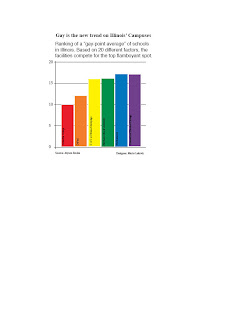
This project was intended to show the class how to make
graphs and
charts with information from an article. The article was about the trending number of gay students amongst colleges and universities in Illinois. I used the
flamboyant colors to represent the
gay flag. Through this project, we learned how to trace in InDesign and how to use those tracings for our own charts and graphs.

That's an interesting way to display information. Visually it works because the colors pop out on the page.
ReplyDeleteGood job.It looks like very proffesional.
ReplyDelete