Friday, December 16, 2011

From Communism to Democracy


This project took a lot of time and patience to finish. Before anything started, I needed to find an immigrant with an amazing story. Once that was done, I had to find a lot of research about her background. Needless to say, this article and composition had to be flawless. It was very time consuming because we had to create our own maps, edit them the way we wanted to, and place them on the page. Along with this, we were in charge of laying out our own page. The hardest part of the project was determining what pictures to put in and which ones to leave out. At the end of the day, I'm happy with how it came out and I think I portrayed her life well on paper.

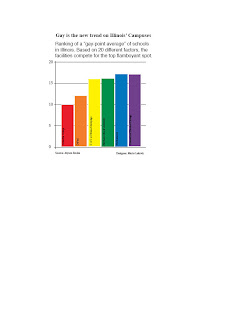
Gay Point Average


This project was intended to show the class how to make graphs and charts with information from an article. The article was about the trending number of gay students amongst colleges and universities in Illinois. I used the flamboyant colors to represent the gay flag. Through this project, we learned how to trace in InDesign and how to use those tracings for our own charts and graphs.

Bright Lights, Dark Streets

Working on this project was extremely fun. It pushed me to go out of my comfort zone which is typical newspaper style layouts, and into the world of websites. I struggled in a creative sense because I did not know how I wanted the website to come out. Because the story was talking about the dirty streets in New York City, particularly Times Square, I decided to go with the black background and some splashes of yellow to portray the night. The night was supposed to compare the darkness between the sun setting and the garbage on the streets.